
Data Engineering
Data models are key to the scalability and reusability of data-driven analytics. Some companies make the mistake of ignoring the importance of data models as they “focus” on the perennial bottom line. In this day and age, however, throwing raw data into databases and digging for it whenever needed, often repeating the same steps of cleaning, processing, and featurizing it, often with different outcomes that require lengthy debugging, is the equivalent of throwing one’s clothes on the floor and not realizing how much the mess is weighing down on the well-being of those who must live with it. In my opinion, robust and scalable data modeling and management, is and will continue to be the number one differentiator between leaders and laggards when it comes to leveraging data science in business applications. Historical business success does not necessarily translate into future success without a solid data engineering foundation.
Lately, I have been thinking a lot about the boundary between data and models, as I have been faced with deciding on the appropriate data science techniques to solve a variety of business problems within the confine of real-world constraints, including resources and compatibility with legacy infrastructure. It all started with the shifting boundary between shallow and deep learners as I was pondering the amount of work that goes into engineering the features of seemingly simple linear regression models.

For more information on this topic as it pertains to discretionary investing, have a look at my latest QuantMinds blog.
Explainability
In Pirates of the Caribbean, the actor Jonathan Pryce impeccably delivers the following line:
“even a good decision, when made for the wrong reasons, can be a wrong decision”
Governor Swann
To me, this encapsulates the essence of why we want our models to be explainable: we want to trust that the outcomes are reached based on relevant and robust patterns discovered in the data, rather than spurious correlations that can break in unpredictable fashion, triggering mayhem. The need for explainability seems to be a matter of debate, with passionate arguments on both sides. Having worked for many years in high-stakes decision environments where negative outcomes are directly imputed to human decision makers, I view ML models no differently than any other models that require human validation: one has to be able to make a case as to why a particular model should be expected to give correct results with high probability and why it should be trusted (perhaps with known caveats).
Good visualizations of intermediate learning steps help us see what is happening behind the curtains (to a certain extent). Attribution (the how) is a much more difficult problem to address. I found the references below to be helpful on this topic:
[1] C. Molnar, Interpretable Machine Learning, https://christophm.github.io/interpretable-ml-book/
[2] S. Carter et al., Exploring Neural Networks with Activation Atlases, https://distill.pub/2019/activation-atlas/
[3] C. Olah et al., Building Blocks of Interpretability, https://distill.pub/2018/building-blocks/
Causality
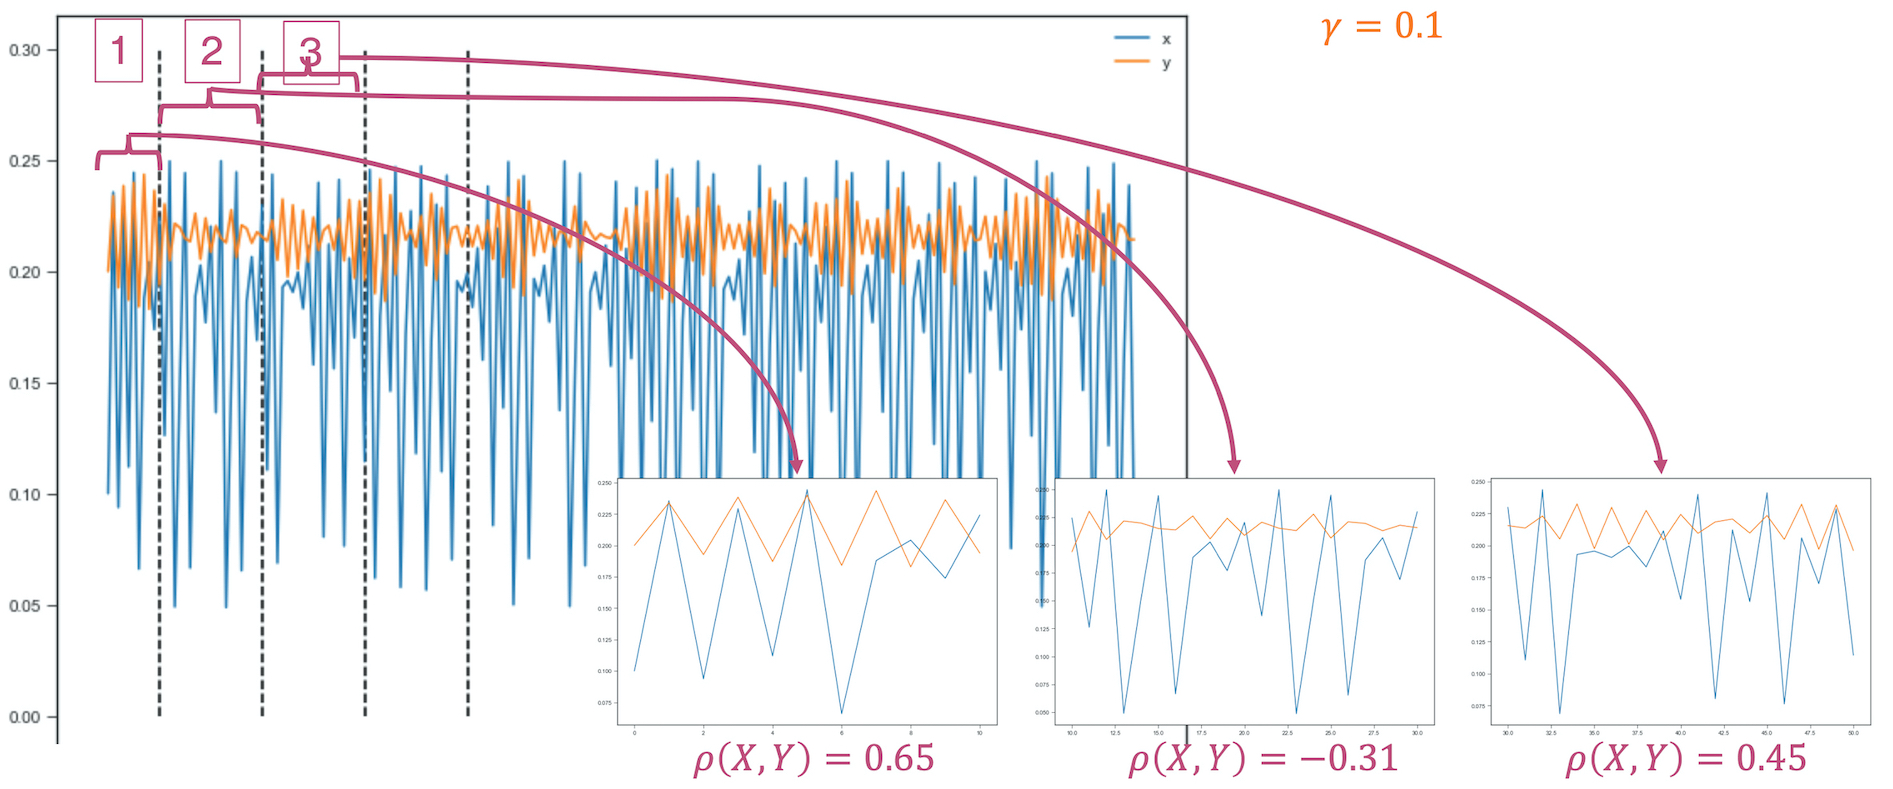
In finance, correlation has been, by far, the predominant lens through which associations in the data are being studied and decided upon. The main mantra is that “correlation does not imply causation”. In my work, I have been more interested by the slightly modified version of this adage: “the lack of correlation does not imply lack of causation” as well as the implications of using linear measures to quantify non-linear dependencies.
I put together a guided tour of causality for finance in my 2020 invited talk at QuantMinds.
Applied AI, ML, Statistical Analysis
Anomaly Detection
Anomaly detection can be difficult when we’re looking for out-of-the-ordinary instances in a dataset, but we don’t exactly know what constitutes “the ordinary” or, at least, we don’t have a precise definition of it. We can define anomalies as deviations from the norm, but most often, in order to find anomalies, we have to model the norm and then quantify deviations from it that are meaningful or significant in some measure of significance, also to be defined as part of our solution.
There is an inherent matter of scale when considering outliers, like for example, finding a 1e-4 among a set of numbers of the order of 1e-5: the former is 10 times larger, so if these numbers represent, say, floating point precisions in a scientific experiment, the 1e-4 could, indeed, correspond to a far less precise measurement than the rest. However, if these were, for instance, profits or losses in a portfolio measured in US dollars, then they are all “the same” and amount to nothing from a monetary point of view (we don’t even have names for money units that small).
Interestingly, scale is not the only aspect that can be tricky when it comes to outliers. Sheer counts or number of occurrences could constitute anomalies as well. Imagine you have a bank account in which you get some daily activity like interest deposits, fee withdrawals, debits, credits, etc., that is, an account where you don’t necessarily know the exact amount of money it holds at any given time, but you have an idea of the rough amount that should be there, say around $10,000. If someone makes a sufficiently large, unauthorized withdrawal from your account (e.g., $5,000), you might notice this immediately as a glaring outlier. However, if many small unauthorized withdrawals were to occur every couple of days, you may not notice until they accumulate to being a sizable amount of transactions to draw your attention. This is true not only in finance, but also in public health where some illness cases may go unnoticed until they spread to larger populations, or in earth sciences where certain small-magnitude events go unnoticed until they gain critical mass.
Rule-based techniques for detecting anomalies rarely work in complex situations. Among these, thresholds (absolute or percentages) are particularly weak as real problems are often multidimensional and setting thresholds along a single dimension typically fails to account for the rest.
This was the case, for example, in our year-long fraud detection project where we worked with corporate clients to identify fraud in claim reimbursements in connection with travel & entertainment expenses. The largest expenses are not automatically fraudulent, and neither are the most frequent fliers. How then, do we define the “norm” in such a case and how do we pinpoint real fraud? Read our paper describing a set of Behavioral Shift Models that combine unsupervised learning with domain knowledge to address this question.
Classification for Prediction and Segmentation
Classification is an interesting topic that can draw upon many techniques to reach a result. The MNIST classification problem is perhaps one of the most famous – automatically assign images of handwritten digits to their correct digit class – and one that has been solved with a variety of techniques.
In the MNIST case, the classes are known in advance (the digits 0, 1, …, 9) and the training is supervised, in the sense that the training images are labeled with the label of the class they belong to. This could be the case in many applications, even though the process of labeling data can be potentially time-consuming and expensive (human labelers are employed to tag data samples, as described in this blog on Data Labelers).
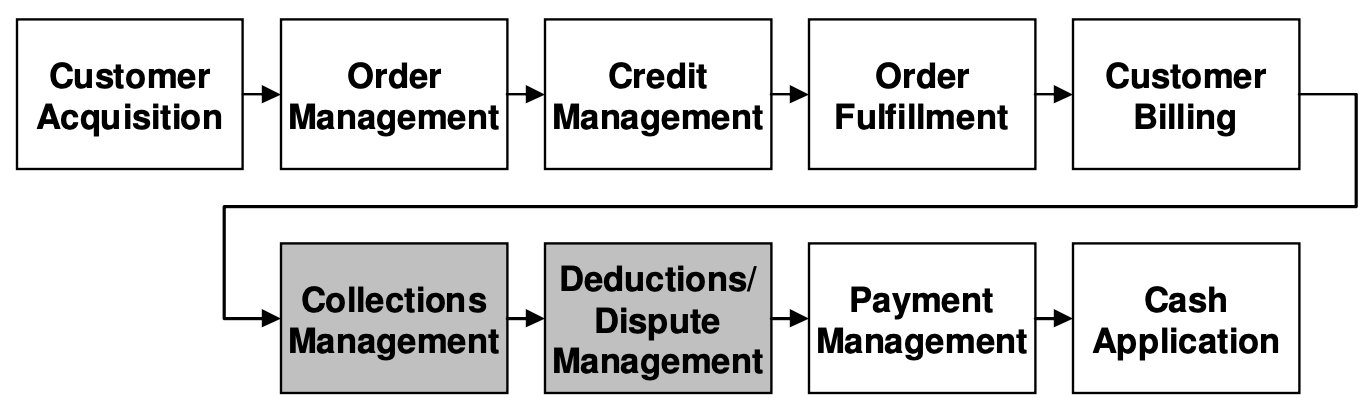
Read our SIGKDD article describing our work with corporate clients to help them improve their Order-to-Cash processes by predicting whether expected invoice payments might be delayed and to estimate the magnitude of those delays.
We have also worked on classification problems where classes may be known in advance, however, the exact criteria of categorizing individual elements into one class or another is rather difficult. For instance, let’s consider the public commentaries of members of the Federal Open Market Committee (FOMC).This is the primary monetary policymaking body of the US Fed and their remarks have outsized power to move financial markets. Reading between the lines of such commentary, identifying what has been said during a recent FOMC meeting or even what has conspicuously been missing, may help portfolio managers setup profitable trading strategies if they are able to predict correctly future market reactions following such speeches. Two typical classes used to categorize FOMC speeches are hawkish and dovish, loosely corresponding to contractionary/expansionary policy leanings, respectively. However, classifying human language into one of these categories (also known as sentiment analysis) is not as easy as it may seem at first glance:
- Hawkish / dovish is a subjective designation: the meaning of being hawkish may change over time and the inclination of any one speaker may also depend on the situation at hand. It is, therefore, challenging to build and maintain an accurate training corpus that reflects the dynamic nature of the class labels.
- Per member historical training data is much shorter than state-of-the-art NLP training algorithms require. Often, it makes more sense to perform the analysis at the level of a central bank, than at the sub-levels of its members. Yet, certain applications may demand a more granular output.
- When extending this type of analysis beyond US markets, we note that while many central banks may offer English translations for their important communications, some semantics may be lost in translation.
- Acquiring a black box labeling software from a third party may help at a coarse level, but to extract predictive value that leads to alpha generation from this type of signal usually demands a refined alignment with a trader’s own views on monetary policy and a proprietary blend of classifier fine-tuning techniques.
In many instances, however, it’s not known in advance what the classes should be so it becomes part of the problem to find relevant categories before performing any classification. In the context of analyzing central bank communications, topic detection has received some attention. This is an unsupervised learning problem: what are the main topics addressed, how many they are, how important they are in relation to the overall communication, and how have they shifted since the last communication or over a longer period of time.
Commonly used in the unsupervised case are nearest-neighbor techniques that seek to find clusters of data in n-dimensional vector spaces. The final clusters constitute the categories to be identified and subsequent classification could proceed as described in the supervised case. Challenges include finding the right vector space and distance metrics, as well as initializing the clustering process.

Read our ACM SIGGRAPH sketch to learn about a cool application of clustering to the reparameterization of 3D models for subsequent texture & geometry editing.
For more clustering applications related to the processing of geometric signals for meshing applications, refer to our domain decomposition paper presented at the Symposium on Geometry Processing.